Each year, shoppers wait with baited breath for the deep discounts on offer during Black Friday and Cyber Monday (BFCM) weekend. This year, however, was clouded by a lack of consumer confidence as shoppers waded through sales, expecting to pay more for less.
Despite the low enthusiasm, online shoppers in the U.S. spent a record $9.8 billion on Black Friday 2023, up 7.5% from last year. Not surprisingly, the top-selling Black Friday product categories – electronics and children’s toys – were directly correlated to the products that had the best discounts.
The revenue from Cyber Monday is also up, sitting at a record $12.4 billion – an increase of 9.7% from Cyber Monday 2022. Experts say the spike in the retail holiday weekend’s sales indicates that price-conscious shoppers were more willing to spend than last year, but still strategically hunted for the best deals to maximize their discounts.
In this blog, we’ll dig into the data to get a better understanding of what happened during BFCM 2023. We’ll start with a big picture look at the economy and how it affected consumer expectations and purchasing decisions. Then, we’ll unveil some unique Syte data on holiday purchases in the fashion, jewelry, and home decor retail categories.
How the Economic Situation Affected BFCM This Year
The past few holiday shopping seasons have been a bit of a roller coaster for retailers and consumers alike. The pandemic, supply chain issues, inflation, and changing interest rates have all taken their toll on consumer spending.
This year, inflation is slowly but steadily moderating, evidenced by October’s 3.2% year-over-year increase. Compared to 2022, that is much closer to the 2% annual increase that the Federal Reserve aims for over the long term. Last year, for example, inflation was up 7.7% in October (at the outset of the holiday shopping season) and it hit the Covid-era peak of 9.1% in June 2022 – the highest rate since November 1981.
As brands and their customers continue to recover from record inflation rates and other pandemic-related challenges, the average consumer discount rate from the past few holiday seasons paints an interesting picture that is one explanation for the low enthusiasm we saw in advance of BFCM 2023.
In 2019, before the pandemic became a worldwide event, the average consumer discount rate was 33% during the holiday season, according to Salesforce. At the height of COVID-19, when consumers had extra savings due to physical store closures and stimulus payments, retailers reduced the average discount rate to 19% in 2020 and to 21% the following year. However, major delays from global supply chain issues meant that many retailers were left with large amounts of merchandise that didn’t arrive on time for the 2021 shopping season.

To clear those items in 2022, retailers offered steep discounts that raised the average discount rate to 28%. This seems to have set a precedent for many shoppers, who were expecting even deeper discounts this year – but that wasn’t the case. After whittling down their overstocked items, retailers ended up with an average discount rate of 30% this past weekend, only up 2% from last year. It was a big disappointment for cost-conscious consumers looking to snag bigger savings. For example, one shopper told Fortune that 25% off “is not a Black Friday deal – [it’s] just a regular sale price.”
Despite the disappointment in available discounts, the drive to spend was still strong – even for shoppers working with tighter budgets due to last year’s record inflation and interest rates. We can see this from Buy Now Pay Later (BNPL) payments, which rose 47% on Black Friday and 42.5% on Cyber Monday compared with 2022, according to Reuters.
Syte Insights on BFCM 2023 Consumer Behavior
Each year on BFCM, Syte operates behind the scenes of millions of online retail transactions in the fashion, jewelry, and home decor verticals. In doing so, we’ve collected a unique set of data that allows us to dive deep into the spending habits and trends developing in each sector. Let’s take a look!
Fashion Trends and Takeaways
An analysis of over four million transactions by nearly 69 million users this Black Friday weekend uncovered the following:
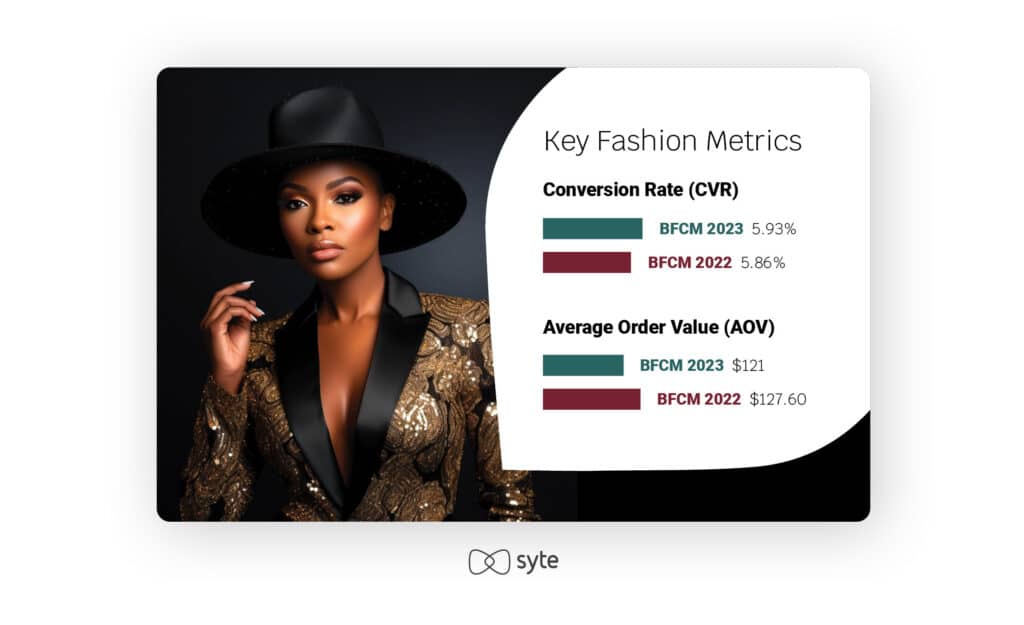
Despite the fact that overall BFCM spend is up, key eCommerce fashion metrics were relatively flat this year. Conversion rates continued to hang just below six percent and average order values remained close to $120. ARPU was also static at just about $7.
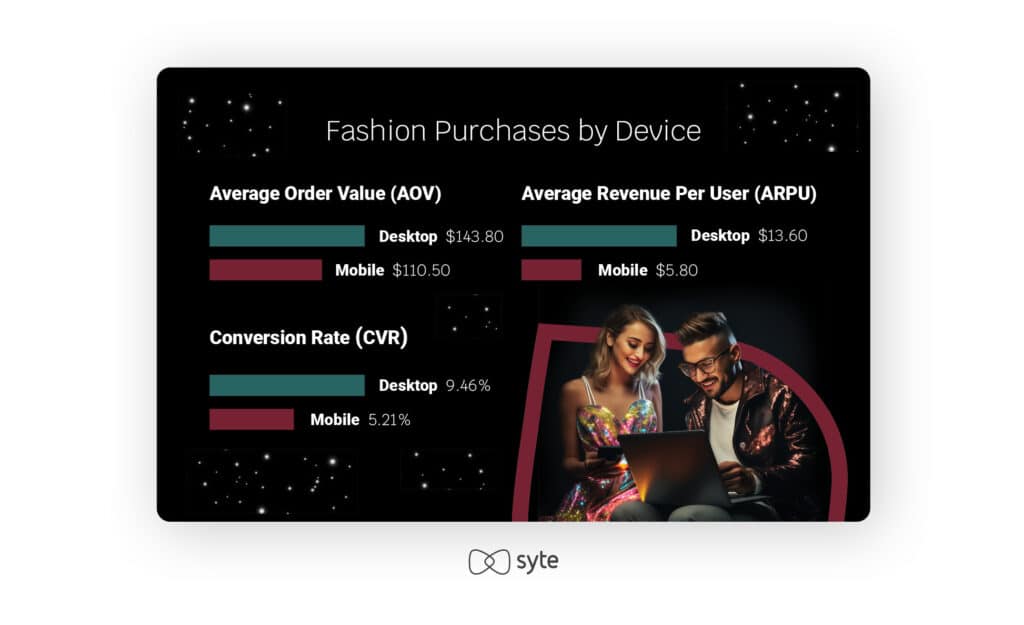
During BFCM 2023, 75.5% of fashion transactions took place on mobile devices. While that is extremely significant, it’s actually lower than the 81% of fashion shoppers who used their mobile devices for transactions throughout the year. This is likely a sign of more considered, pre-planned purchasing, as demonstrated by the significantly higher AOV, ARPU and CVR for desktop purchases in fashion. These numbers show us that many shoppers took to their computers for a dedicated shopping session, perhaps hoping to load up on purchases for much of the coming year, or to finally bring home pricier items they’ve had their eye on and researched for a while.
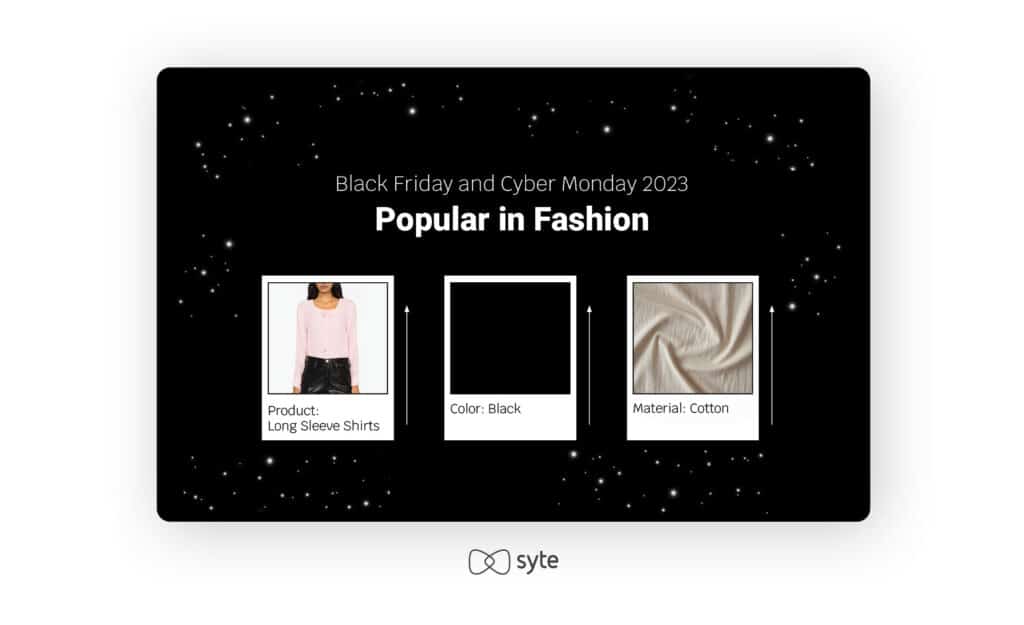
At Syte, we use a combination of visual AI to analyze catalogue images and generative AI to create text-based product tags for those items. These AI-powered tags give us a unique view into the product details that are selling the most – and we overwhelmingly saw a trend toward basics. People were loading up on casual apparel made from comfortable materials in classic colors. This is another nod to the practical, focused, and budget-conscious shopper.
Jewelry Trends and Takeaways
An analysis of over 200,000 transactions by more than nine million users showed the following:
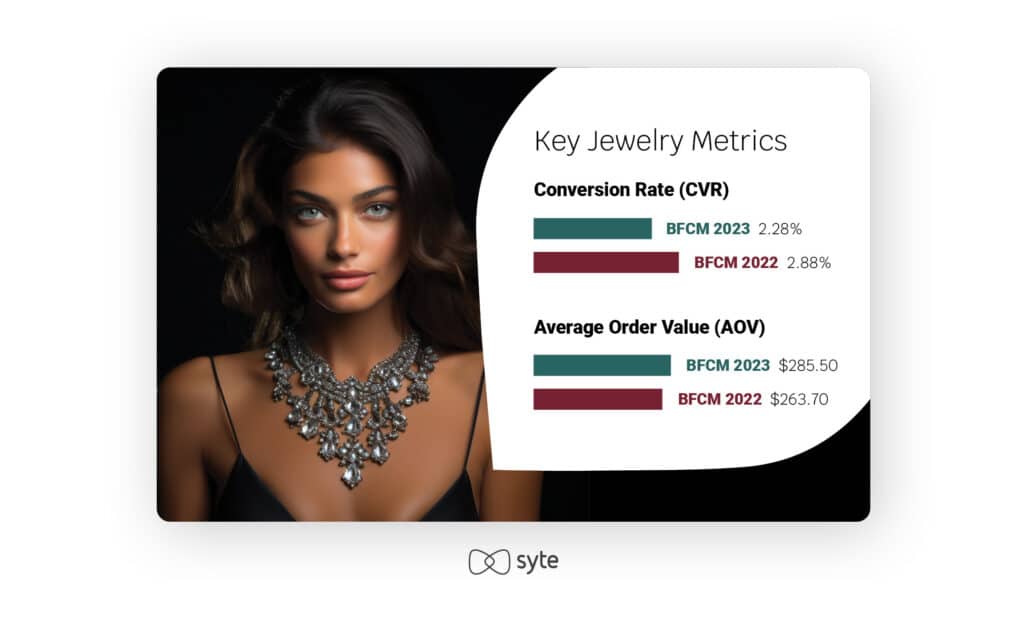
In the jewelry industry, we saw a slight decrease in CVR and an 8.27% increase in AOV. Interestingly, jewelry is the only one of the three industries we surveyed that had an increase in AOV. This is likely related to the fact that many buyers wait for the big holiday sales to purchase expensive jewelry that they intend to gift to loved ones over Christmas, New Year’s and even Valentine’s Day.
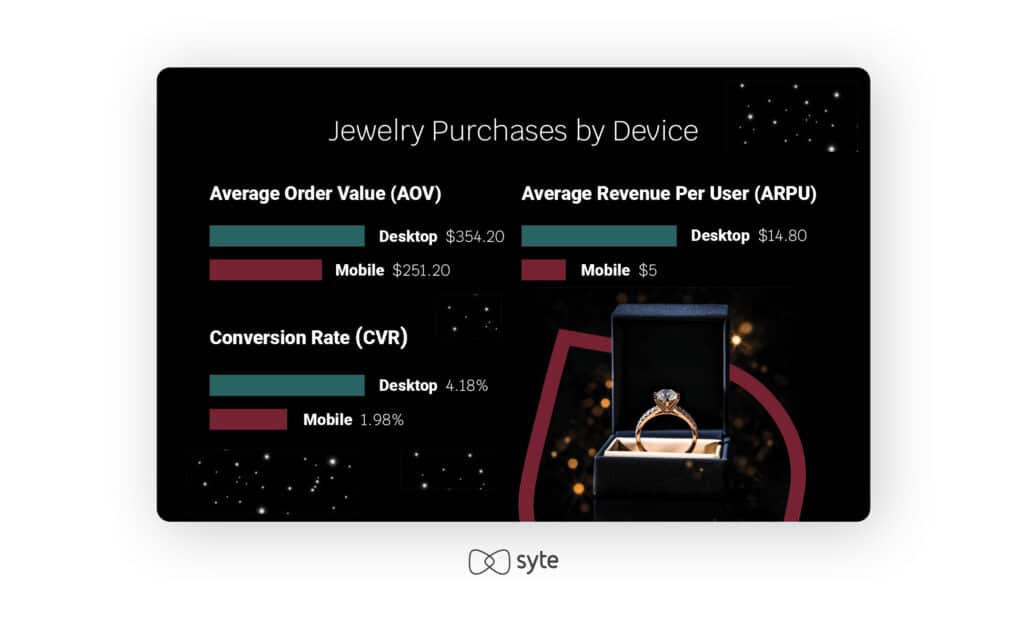
During BFCM 2023, only 28.1% of transactions came from desktop purchases – but the AOV on those sales was 41% higher than mobile purchases. This means that highly goal-oriented shoppers were more likely to buy – and spend more – from their desktops than their mobile devices. With that in mind, jewelry brands would be wise to invest more on their desktop experience ahead of BFCM, particularly when it comes to recommending additional items to receptive shoppers.
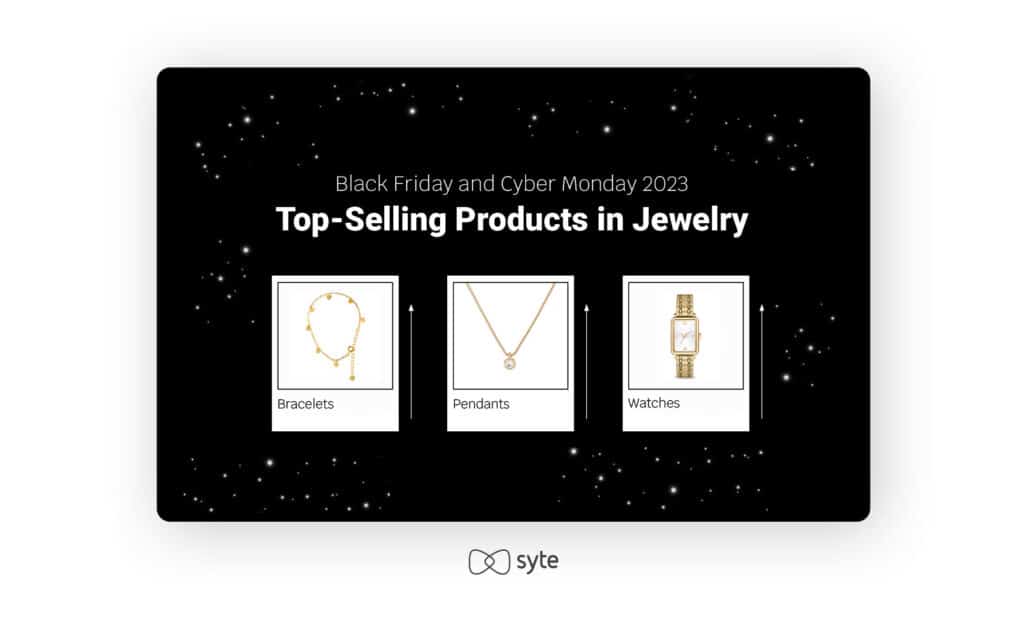
Our analysis of the most popular AI-powered product tags in jewelry show that the top-sellers were bracelets, pendants, and watches. The hottest selling materials were silver and yellow gold, and when it comes to diamonds, the classic (and cheapest) round shape was the dominant cut. Notably, bracelets pushed out rings as the top-selling category during BFCM this year – an interesting change considering these sales are a well-documented opportunity to purchase engagement rings at a reasonable price ahead of the holidays.
Home Decor Trends and Takeaways
An analysis of over 22,000 transactions by more than 3.5 million users showed the following:
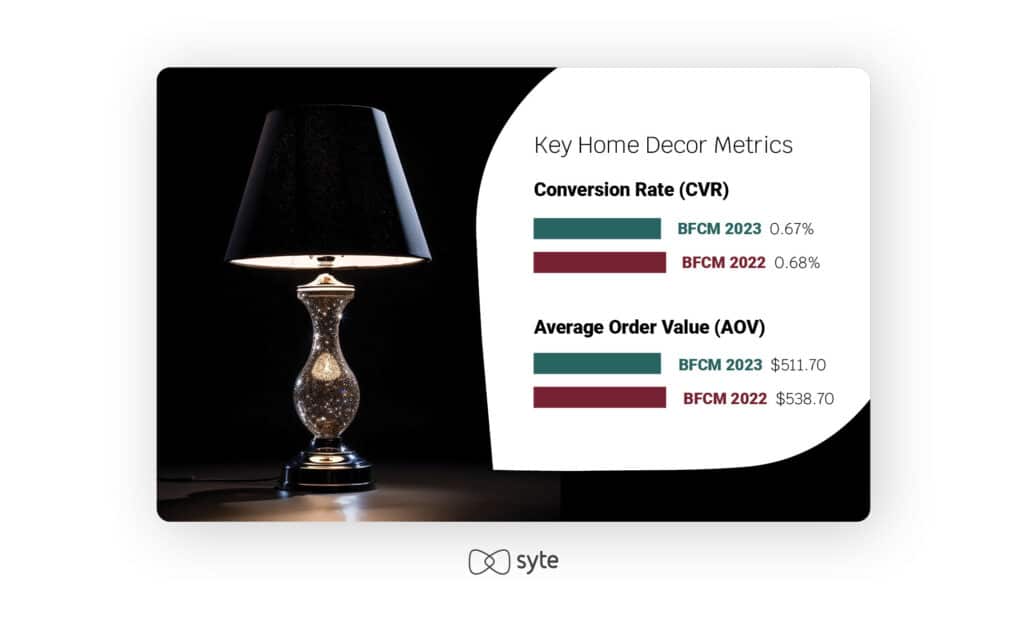
Despite the fact that overall BFCM spend is up, the CVR in the home decor industry remained flat between this year and last year, and AOV actually dropped by about 5%. This is likely due to the fact that home decor shoppers are not spending their money on big ticket items like furniture. Instead, as you can see below, they are more focused on smaller items, like pillows and bedding.
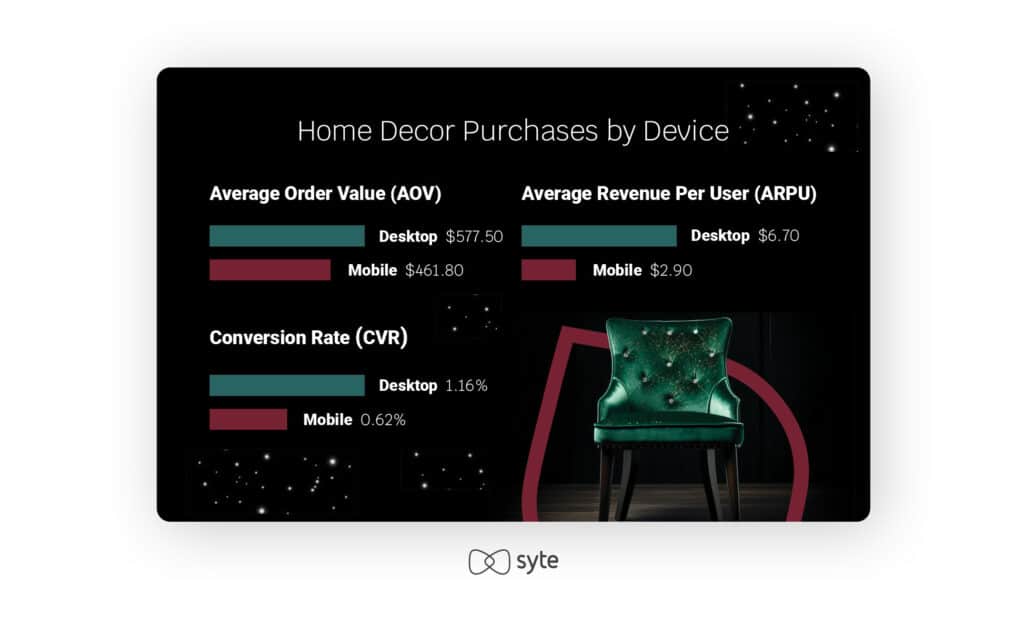
During BFCM 2023, 42.5% of home decor transactions came from desktop purchases. Similar to the jewelry industry, the AOV from desktop purchases was significantly higher – a 25.05% increase. Again, this makes the desktop experience a key component for home decor brands and retailers to focus on improving and adding cross-sell and upsell opportunities for these receptive shoppers.
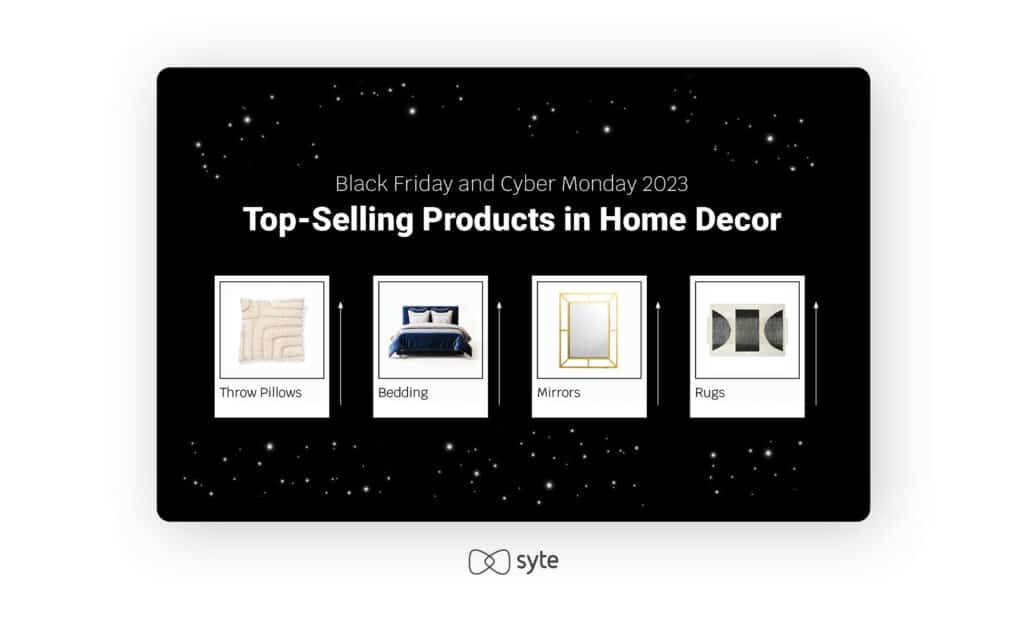
Our analysis of the most popular AI-powered product tags in home decor show that the top-sellers were accessories like throw pillows, bedding, mirrors, and rugs. This indicates that shoppers are holding out to make larger furniture purchases at a different time and are instead trying to beautify the rooms they already have set up.
Retailer Spotlight: The Impact of AI on November 2023 Sales
The holiday shopping season doesn’t start with Black Friday and Cyber Monday. Many retailers offer special discounts, promotions and flash sales from the beginning of November, so let’s zoom out for a moment and look at some key findings from the full month of November.
- ARPU was higher across the board in fashion, jewelry, and home decor for shoppers who engaged with Syte’s visual AI products. The difference is significant – up 132.43% in fashion, up 309.8% in home decor, and up a whopping 918.6% in jewelry as compared to those who didn’t use our visual AI tools during their shopping journey.
- The same went for CVR, which shot up from 4.71% to 17.44% for fashion shoppers engaging with Syte products. In jewelry, CVR increased from 1.01% to 7.56% for shoppers using Syte solutions, and in home decor, CVR increased from 0.55% to 2.14% for brands with visual AI solutions on-site.
- In the jewelry vertical, the AOV for the month of November was 23.2% higher for shoppers using Syte solutions.
- In fashion, the average items per order increased from 2.28 to 3.37 for shoppers using our visual AI solutions.
The numbers here show us how important AI tools can be to help brands and retailers improve holiday sales by really helping their customers find the products they’re looking for.
Keep the Momentum Going by Appealing to Price-Conscious Shoppers
After the roller coaster ride of the past few years’ holiday shopping seasons, BFCM 2023 highlighted just how important it is for brands and retailers to continue catering their products and advertisements to appeal to price-conscious consumers throughout the rest of the holiday season and into the New Year. All of our data points to the fact that people are buying smartly, looking for deals on basic items that will serve them in their day-to-day lives, and when it comes to splurge items, they’re doing their research and buying carefully on desktop.